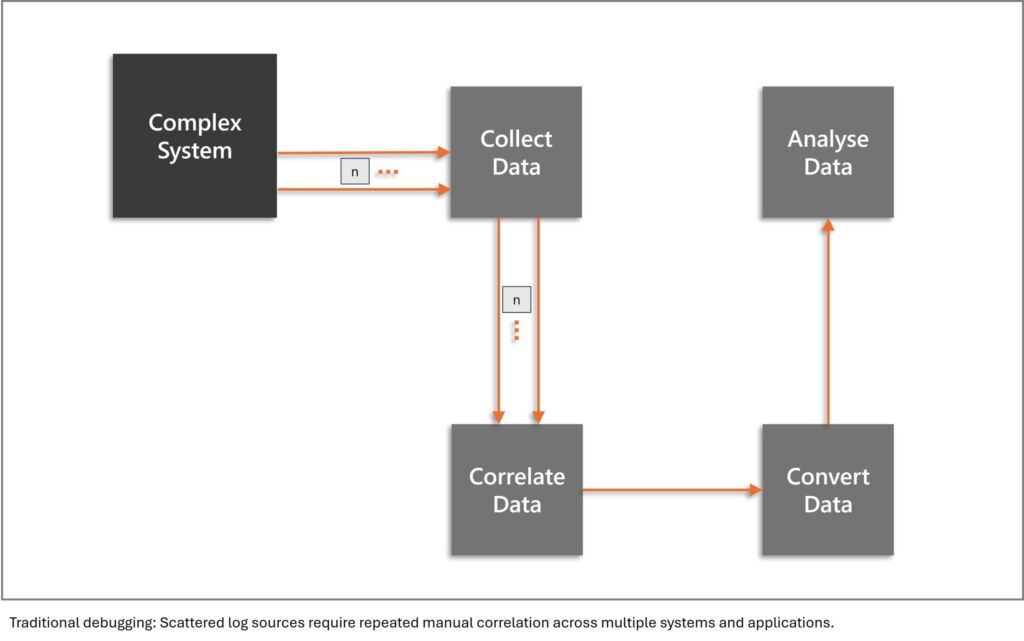
Reproducing issues in a lab setup is often time-consuming or even impossible when hardware or environment-specific conditions are involved. This requires considerable experience or time to find and fix those issues. However, a more systematic approach is preferable, as experience and time are not always available and are typically expensive when they are. While the machine vision industry has traditionally relied on logs and ad-hoc diagnostics to investigate issues, these tools often fall short when it comes to understanding how systems behave in real-world conditions when interacting with each other. Fortunately, the software engineering world offers solutions to similar problems. The key is to make those systems observable, in a vendor agnostic standardized manner. This approach delivers better telemetry data and aligned data, creating significant potential to accelerate analysis.
What is OpenTelemetry?
Before diving deeper, it is important to clarify what we mean by telemetry in the machine vision context. We are not collecting user behaviour data, nor is this a GDPR-related topic. Instead, telemetry refers to system-level observability, providing structured and contextualized insights into how components of a machine vision system interact, perform, and fail. The system owner maintains full control over the data at all times.
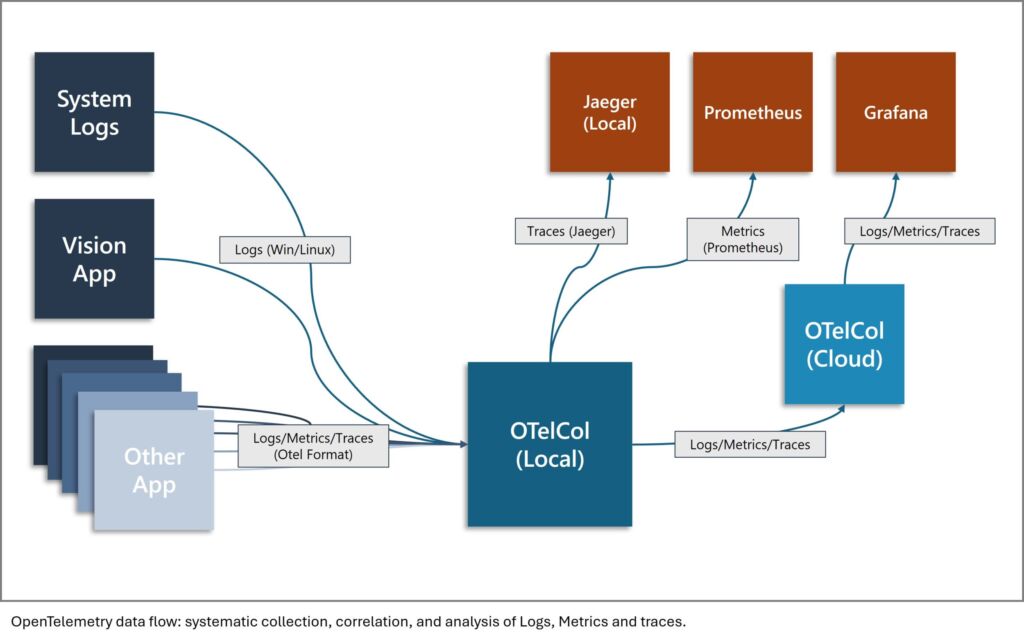
OpenTelemetry is an open-source project under the Cloud Native Computing Foundation that provides a standard way to collect telemetry data – specifically logs, traces, and metrics – from software systems. Originally designed for microservice-based cloud applications, OpenTelemetry’s concepts extend beyond a specific domain. OpenTelemetry defines APIs and protocols to collect and emit structured telemetry data. Different data sources are aggregated and by an open-source service utility called OpenTelemetry Collector. This approach aligns and correlates well-established data sources like system events or kernel logs while making custom receiver creation straightforward. Once the data is collected, it can be exported and analysed using popular observability backends such as Jaeger or Prometheus. In the following, let us focus on logs and traces for the purpose of searching and fixing issues.
Why Prefer Tracing over Logging
Logging is familiar territory. Almost every software system already produces logs in some form. However, traditional logs have limitations, particularly when lacking standardisation. They tend to be unstructured and difficult to correlate across modules. Their widespread use can create overwhelming volumes, making analysis more challenging than useful. Most critically, they lack context about causality and relationships between events.
This is where tracing can add significant value. A trace in OpenTelemetry represents a single request or operation as it flows through a system, capturing each step (called a span) along the way. Each span includes metadata such as start/end time, status, and tags. These spans are linked hierarchically and carry a unique trace ID that binds them together. This hierarchical structure allows users to reconstruct the execution path of an application while simplifying the handling of large volumes. For each span, you can see where time is spent, quickly identifying delays in different stages or modules. Furthermore, trace and span IDs may be propagated across library, process and even hardware boundaries to observe task executing on distributed systems. Unlike logs, traces provide end-to-end context that reveals what happened, why, and how. Combined with structured logging that includes the same trace and span IDs, this enables powerful filtering and can provide a massive speedup for analysis.
Example: Multi Camera System
Image a multi camera system that works fine. At some point there is an OS update, and switches are upgraded to new models by the IT department. Soon after, the operator reports sporadic issues when starting the application. Besides still working most of the time, sometimes it just takes too long, resulting in a timeout, and sometimes the cameras stream corrupt images due to packet loss. This is what classing logging will tell you. With tracing from your application down the acquisition stack, you would be able to see that camera discovery runs on the NICs it is supposed to but also on other NICs. This wastes time and sometimes incorrectly detects the wrong cameras due to now improper topology patching. Restricting the discovery provides a fast and simple fix. Even more importantly, the root cause is quickly identified and can be addressed systematically. You can easily see how much more time could have been invested in this issue without getting closer to the root cause – for example, by rolling back the OS update or rebuilding the topology in the lab.


![Die [me] – mechatronik & engineering wird digital](https://cdn.tedo.be/tedo-mu/wp_uploads/sites/10/2026/03/Unbenannt.jpeg)